Excel files continue to play a significant role in our lives even though we get data in a variety of ways. In this post, I’ll explain how to use two different ways to import many excel files at once while you’re working with multiple files. We will combine and transform the files in addition to importing them.
The files will be obtained from the BRSA, the Banking Regulatory and Supervision Agency. Please follow the steps below.
https://www.bddk.org.tr/ (The language option is located on the upper right corner of the website)
Data, Monthly Bulletin, Monthly Banking Sector Data
Information: Ratios
I downloaded the files as of January 2018. You are free to download as much as you want. If you want to use the excel files I downloaded, the post39 file is available here.
One way is to import using a for loop.
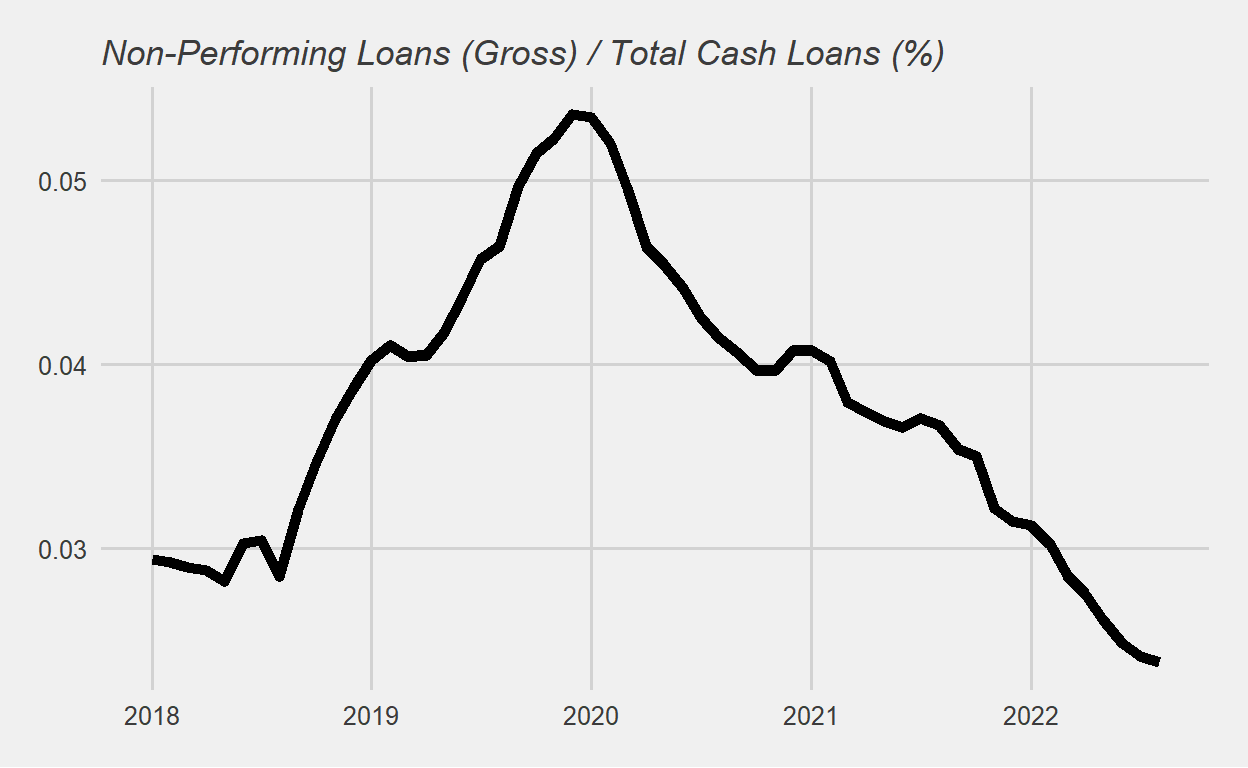
A list named data_list has been created. With the help of the for loop, we can now combine the elements in it. Let’s create a new dataframe called df and combine the output with it every time the loop finishes. We are interested in the Non-Performing Loans (Gross) / Total Cash Loans (%) variable.
df <- data.frame()

for(i in 1:length(data_list)){

  # Part 1

  tbl <- as.data.frame(data_list[i]) %>%
    select(3,4) %>%
    rename(
      "Title"=1,
      "Value"=2
    ) %>%
    mutate(
      "Year" = word(str_squish(data_files[i]),2,sep = "\\_"),
      "Month" = gsub(".xlsx","",word(str_squish(data_files[i]),3,sep = "\\_")),
      "Date" = ymd(paste0(Year,".",Month,".",1))
    )

  # Part 2

  df <- df %>%
    bind_rows(tbl)

  # Part 3

  if(i == length(data_list)){

    df <- df %>%
      filter(
        Title == "Non-Performing Loans (Gross) / Total Cash Loans (%)"
      ) %>%
      select(-Year,-Month) %>%
      arrange(Date)

  }

}
| Title | Value | Date |
|---|---|---|
| Non-Performing Loans (Gross) / Total Cash Loans (%) | 2.940388 | 2018-01-01 |
| Non-Performing Loans (Gross) / Total Cash Loans (%) | 2.923954 | 2018-02-01 |
| Non-Performing Loans (Gross) / Total Cash Loans (%) | 2.897354 | 2018-03-01 |
| Non-Performing Loans (Gross) / Total Cash Loans (%) | 2.883592 | 2018-04-01 |
| Non-Performing Loans (Gross) / Total Cash Loans (%) | 2.821168 | 2018-05-01 |
The second way will have shorter code.
setwd("./data")
data_files <- list.files(pattern = "*.xlsx")
data_list <- lapply(data_files, read_excel, col_names = FALSE)
df <- plyr::ldply(data_list, data.frame) %>%
  select(3,4) %>%
  rename(
    "Title"=1,
    "Value"=2
  ) %>%
  filter(
    Title == "Non-Performing Loans (Gross) / Total Cash Loans (%)"
  ) %>%
  mutate(
    "FileName" = str_squish(data_files),
    "Year" = word(data_files,2,sep = "\\_"),
    "Month" = gsub(".xlsx","",word(str_squish(data_files),3,sep = "\\_")),
    "Date" = ymd(paste0(Year,".",Month,".",1))
  ) %>%
  select(Title,Value,Date) %>%
  arrange(Date)
| Title | Value | Date |
|---|---|---|
| Non-Performing Loans (Gross) / Total Cash Loans (%) | 2.940388 | 2018-01-01 |
| Non-Performing Loans (Gross) / Total Cash Loans (%) | 2.923954 | 2018-02-01 |
| Non-Performing Loans (Gross) / Total Cash Loans (%) | 2.897354 | 2018-03-01 |
| Non-Performing Loans (Gross) / Total Cash Loans (%) | 2.883592 | 2018-04-01 |
| Non-Performing Loans (Gross) / Total Cash Loans (%) | 2.821168 | 2018-05-01 |
When it comes to coding, there are numerous solutions. In this post, I offered two ways to the topic I mentioned.
df %>%
  mutate(Value = as.numeric(Value)/100) %>%
  ggplot(aes(x = Date, y = Value)) +
  geom_line(size = 2) +
  ggthemes::theme_fivethirtyeight() +
  theme(plot.title = element_text(face = "italic", size = 13)) +
  labs(title = "Non-Performing Loans (Gross) / Total Cash Loans (%)")