Emojis are widely used, and data & text analysis should take them into account. The good news is that it’s not a big deal to get emojis and use them in the analysis.
I’ll show you how to get emojis from WhatsApp chats. To get your own, follow the steps outlined here. Why not give them a little surprise?
You can easily import whatsapp chats downloaded in txt format into R using the {rwhatsapp} package.
chat <- rwa_read("wp.txt")
The column names are listed below.
time
author
text
source
emoji
emoji_name
We’ll be interested in the author and emoji columns.
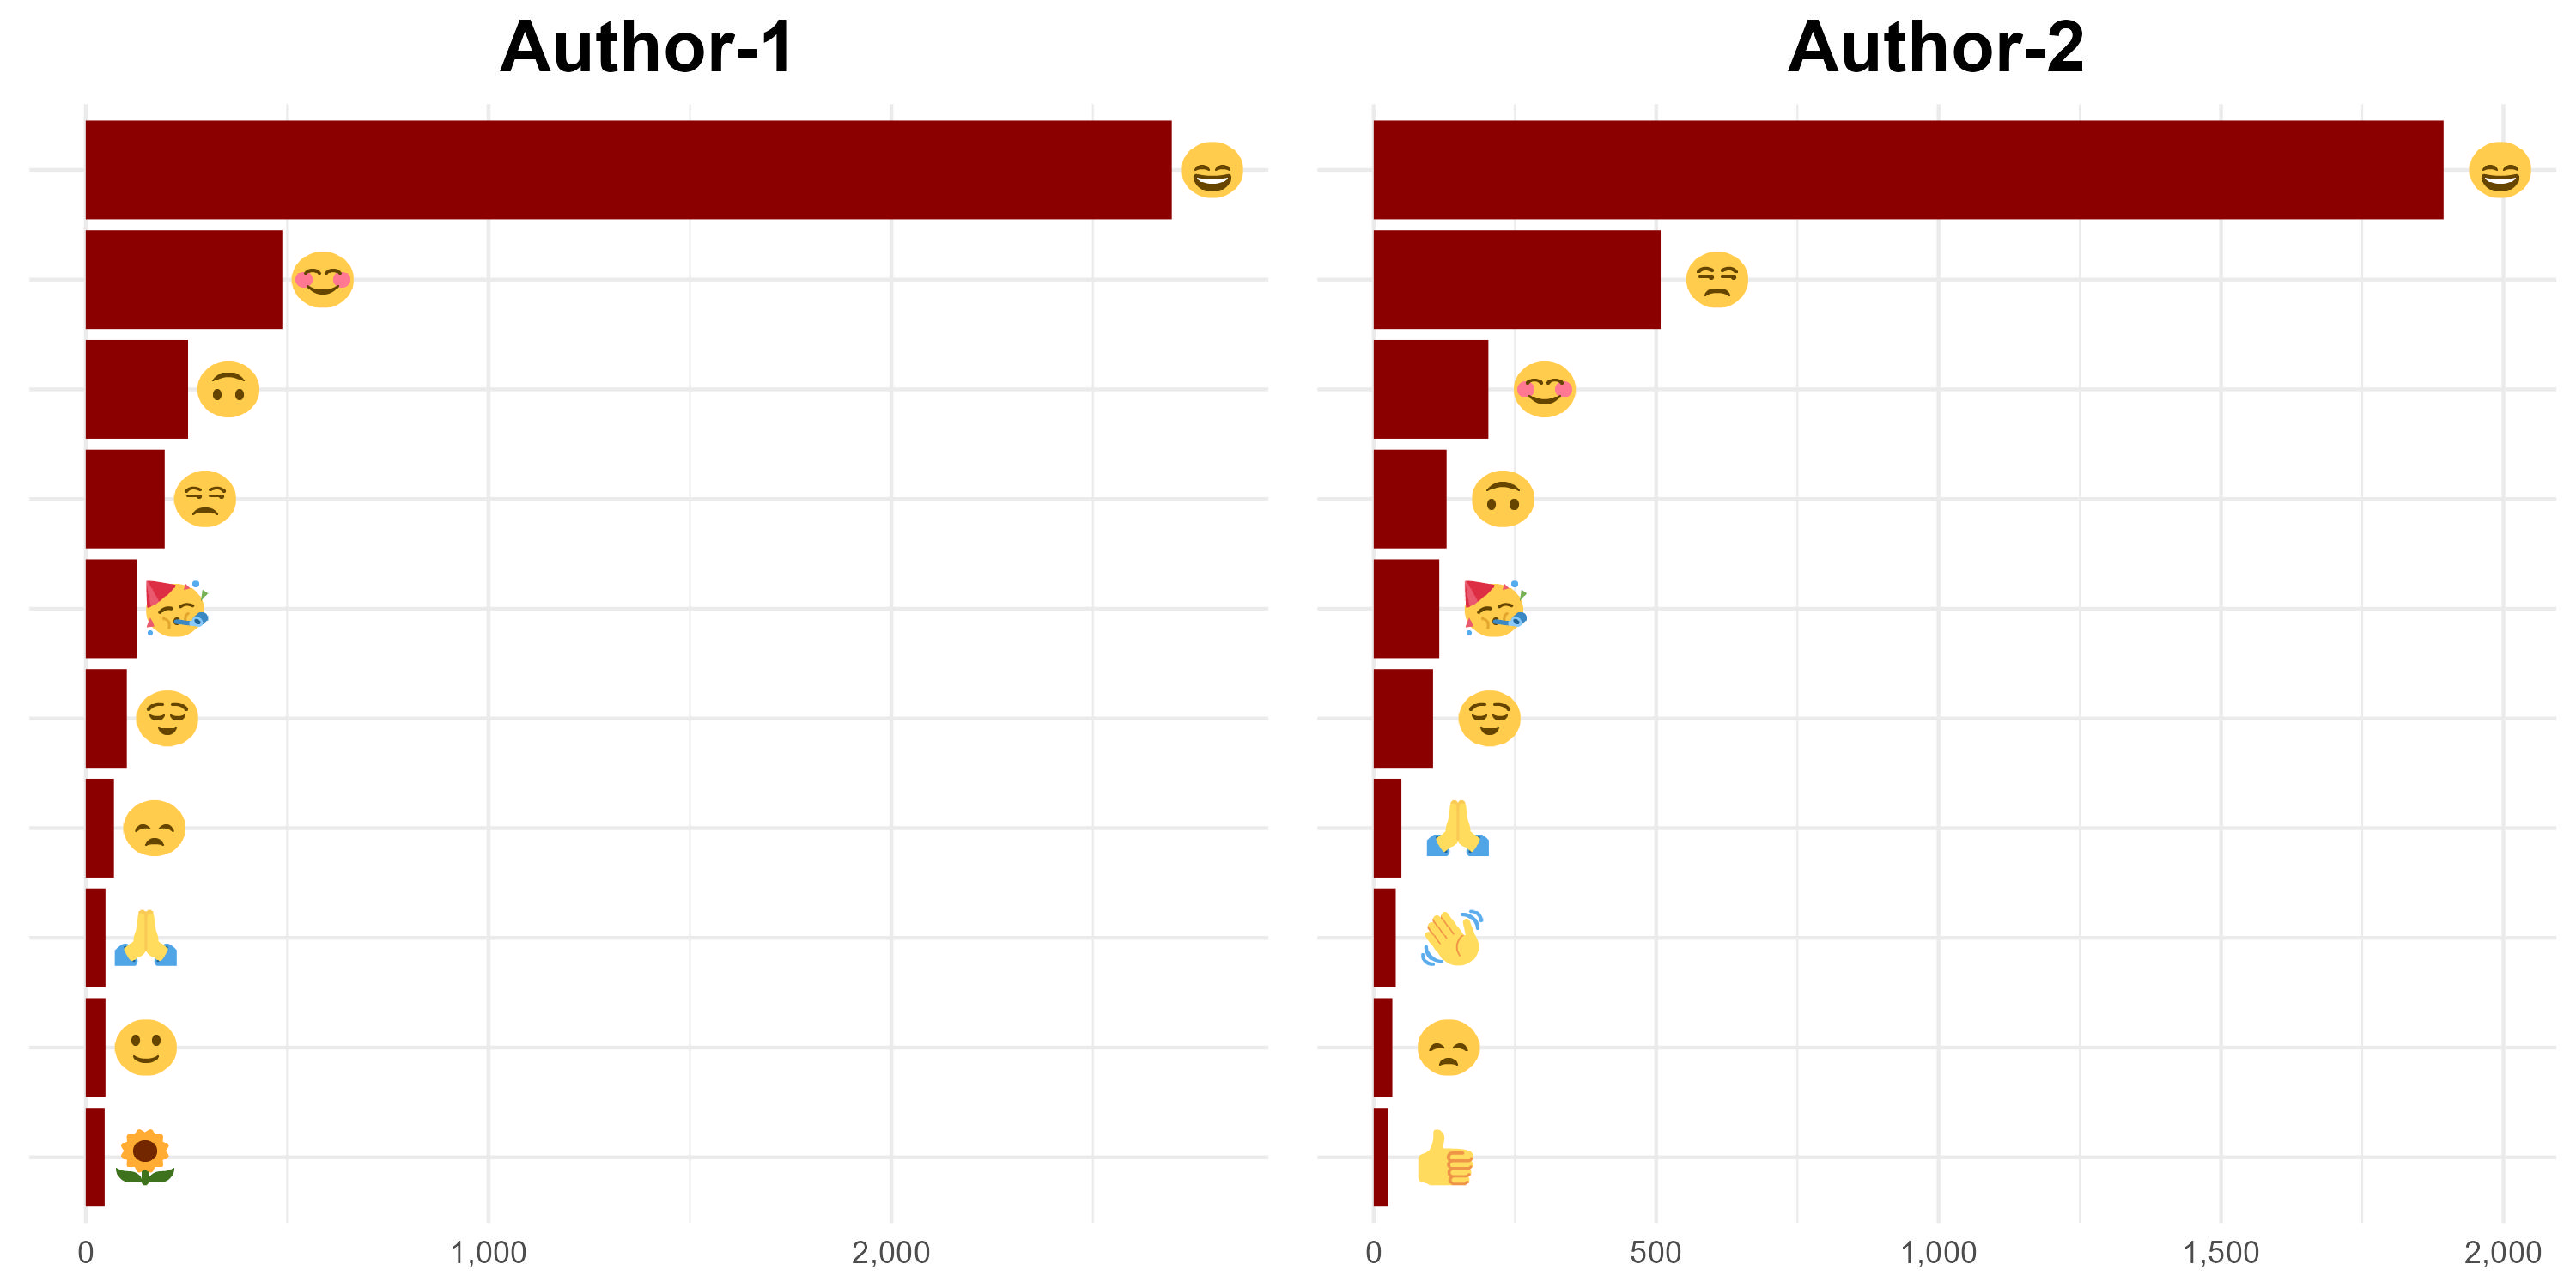
We can obtain the most frequently used emojis after importing the emoji data.
Top 10 emojis used by the Author-1:
df %>%
  unnest(emoji) %>%
  count(author, emoji, sort = TRUE) %>%
  filter(author == "Author1") %>%
  top_n(n = 10, n) %>%
  left_join(emoji_data, by = "emoji") %>%
  ggplot(aes(x = reorder(emoji, n), y = n)) +
  geom_col(fill = "dark red") +
  geom_image(aes(y = n + 100, image = emoji_url)) +
  theme_minimal() +
  theme(axis.text.y = element_blank(),
        axis.title = element_blank(),
        plot.title = element_text(face = "bold", size = 20, hjust = 0.5)) +
  scale_y_continuous(labels = scales::comma) +
  coord_flip() +
  labs(title = "Author-1") -> g1
Top 10 emojis used by the Author-2:
df %>%
  unnest(emoji) %>%
  count(author, emoji, sort = TRUE) %>%
  filter(author == "Author2") %>%
  top_n(n = 10, n) %>%
  left_join(emoji_data, by = "emoji") %>%
  ggplot(aes(x = reorder(emoji, n), y = n)) +
  geom_col(fill = "dark red") +
  geom_image(aes(y = n + 100, image = emoji_url)) +
  theme_minimal() +
  theme(axis.text.y = element_blank(),
        axis.title = element_blank(),
        plot.title = element_text(face = "bold", size = 20, hjust = 0.5)) +
  scale_y_continuous(labels = scales::comma) +
  coord_flip() +
  labs(title = "Author-2") -> g2
You can save the image with the code snippet shown below.
g <- gridExtra::arrangeGrob(g1, g2, nrow = 1)
ggsave(file="wp.jpg", g, width = 10, height = 5)