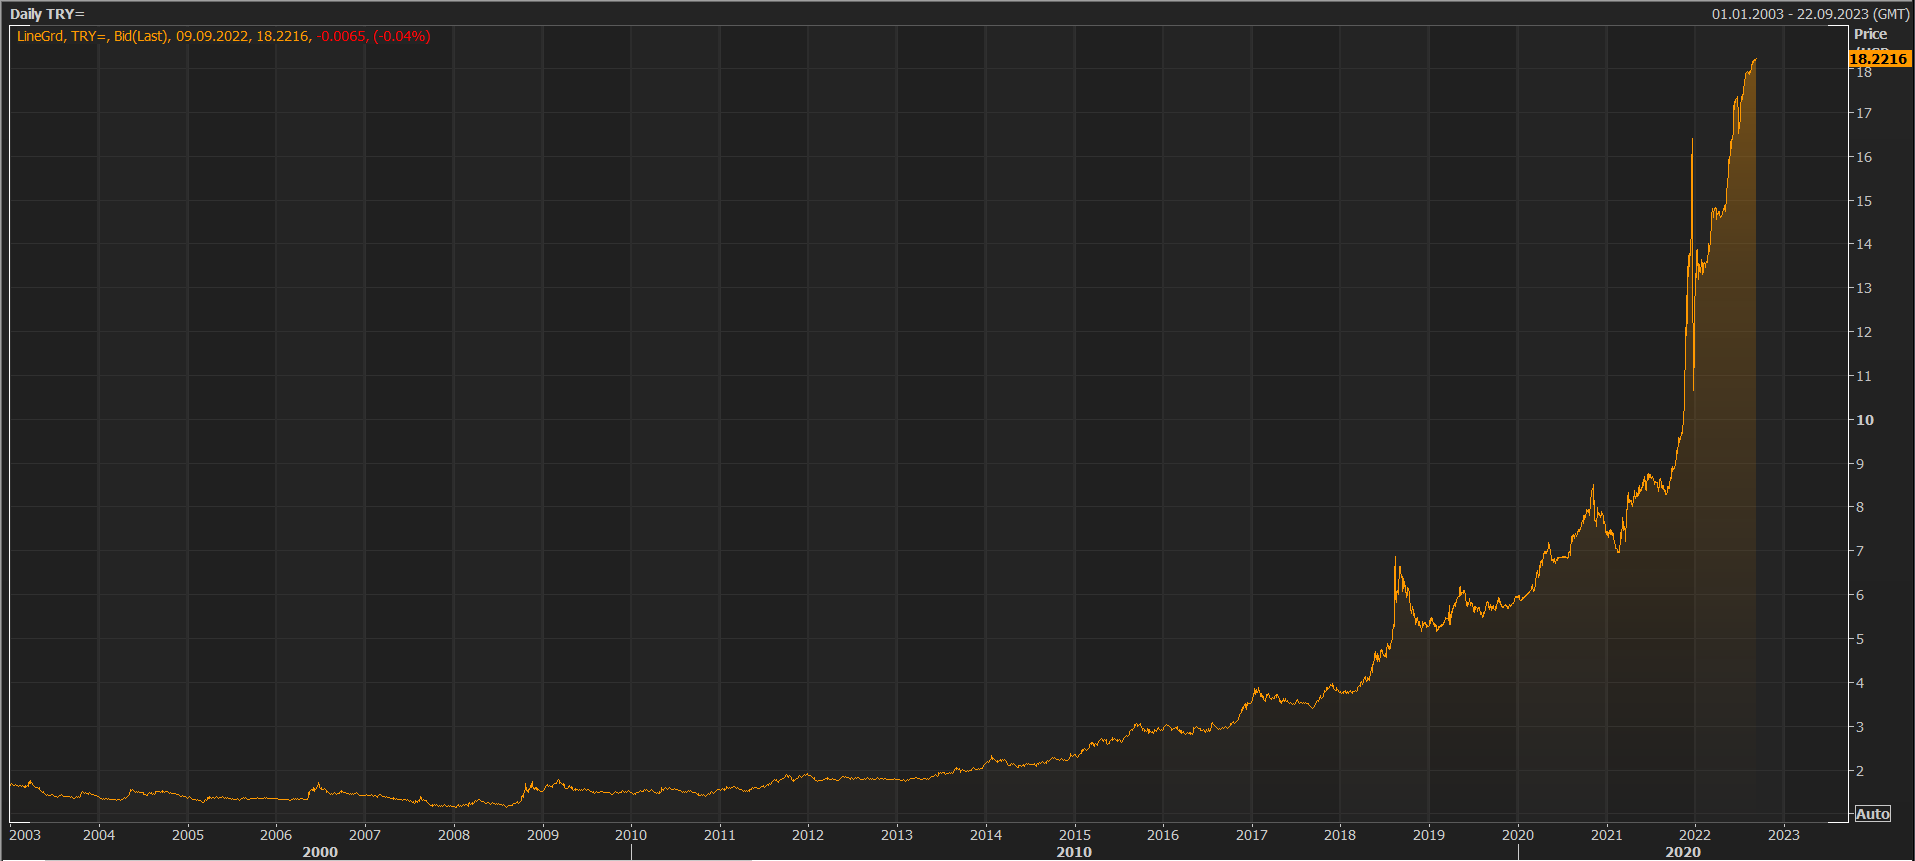
It is critical to convey data through beautiful visualizations in addition to being rich in data. Reuters is a platform where I can provide an example of what I just said.
In this post, we will use ggplot2 to create a Reuters-style chart. I’d like to emphasize that our goal is not to make exactly the same thing, but to capture the main style.
You are free to use any data you want, but if you want to use the data from this post, download the post26.xlsx file here.
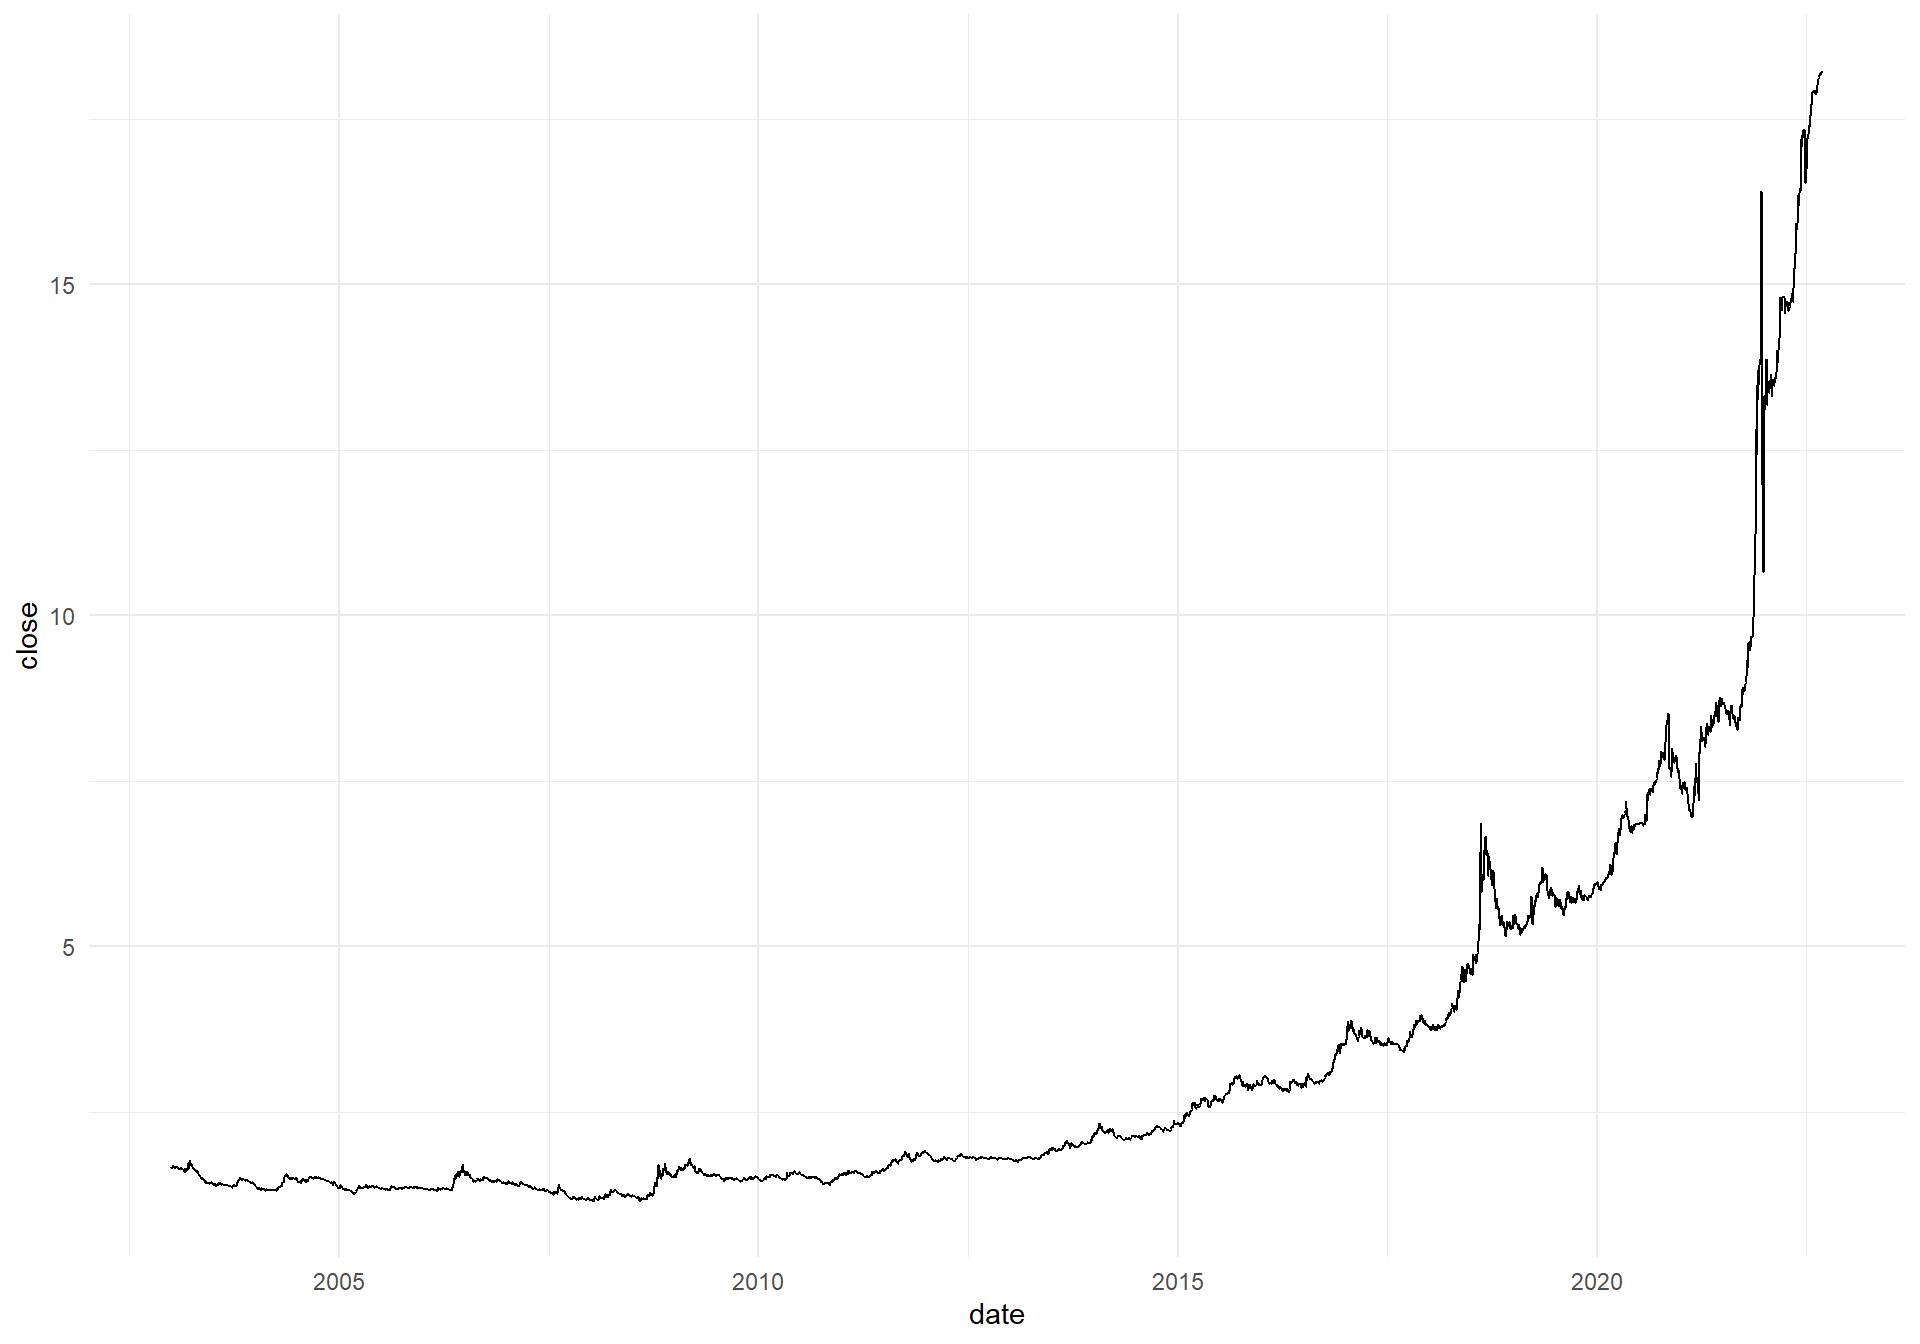
ggplot(df, aes(x = date, y = close)) +
  geom_line() +
  theme_minimal()
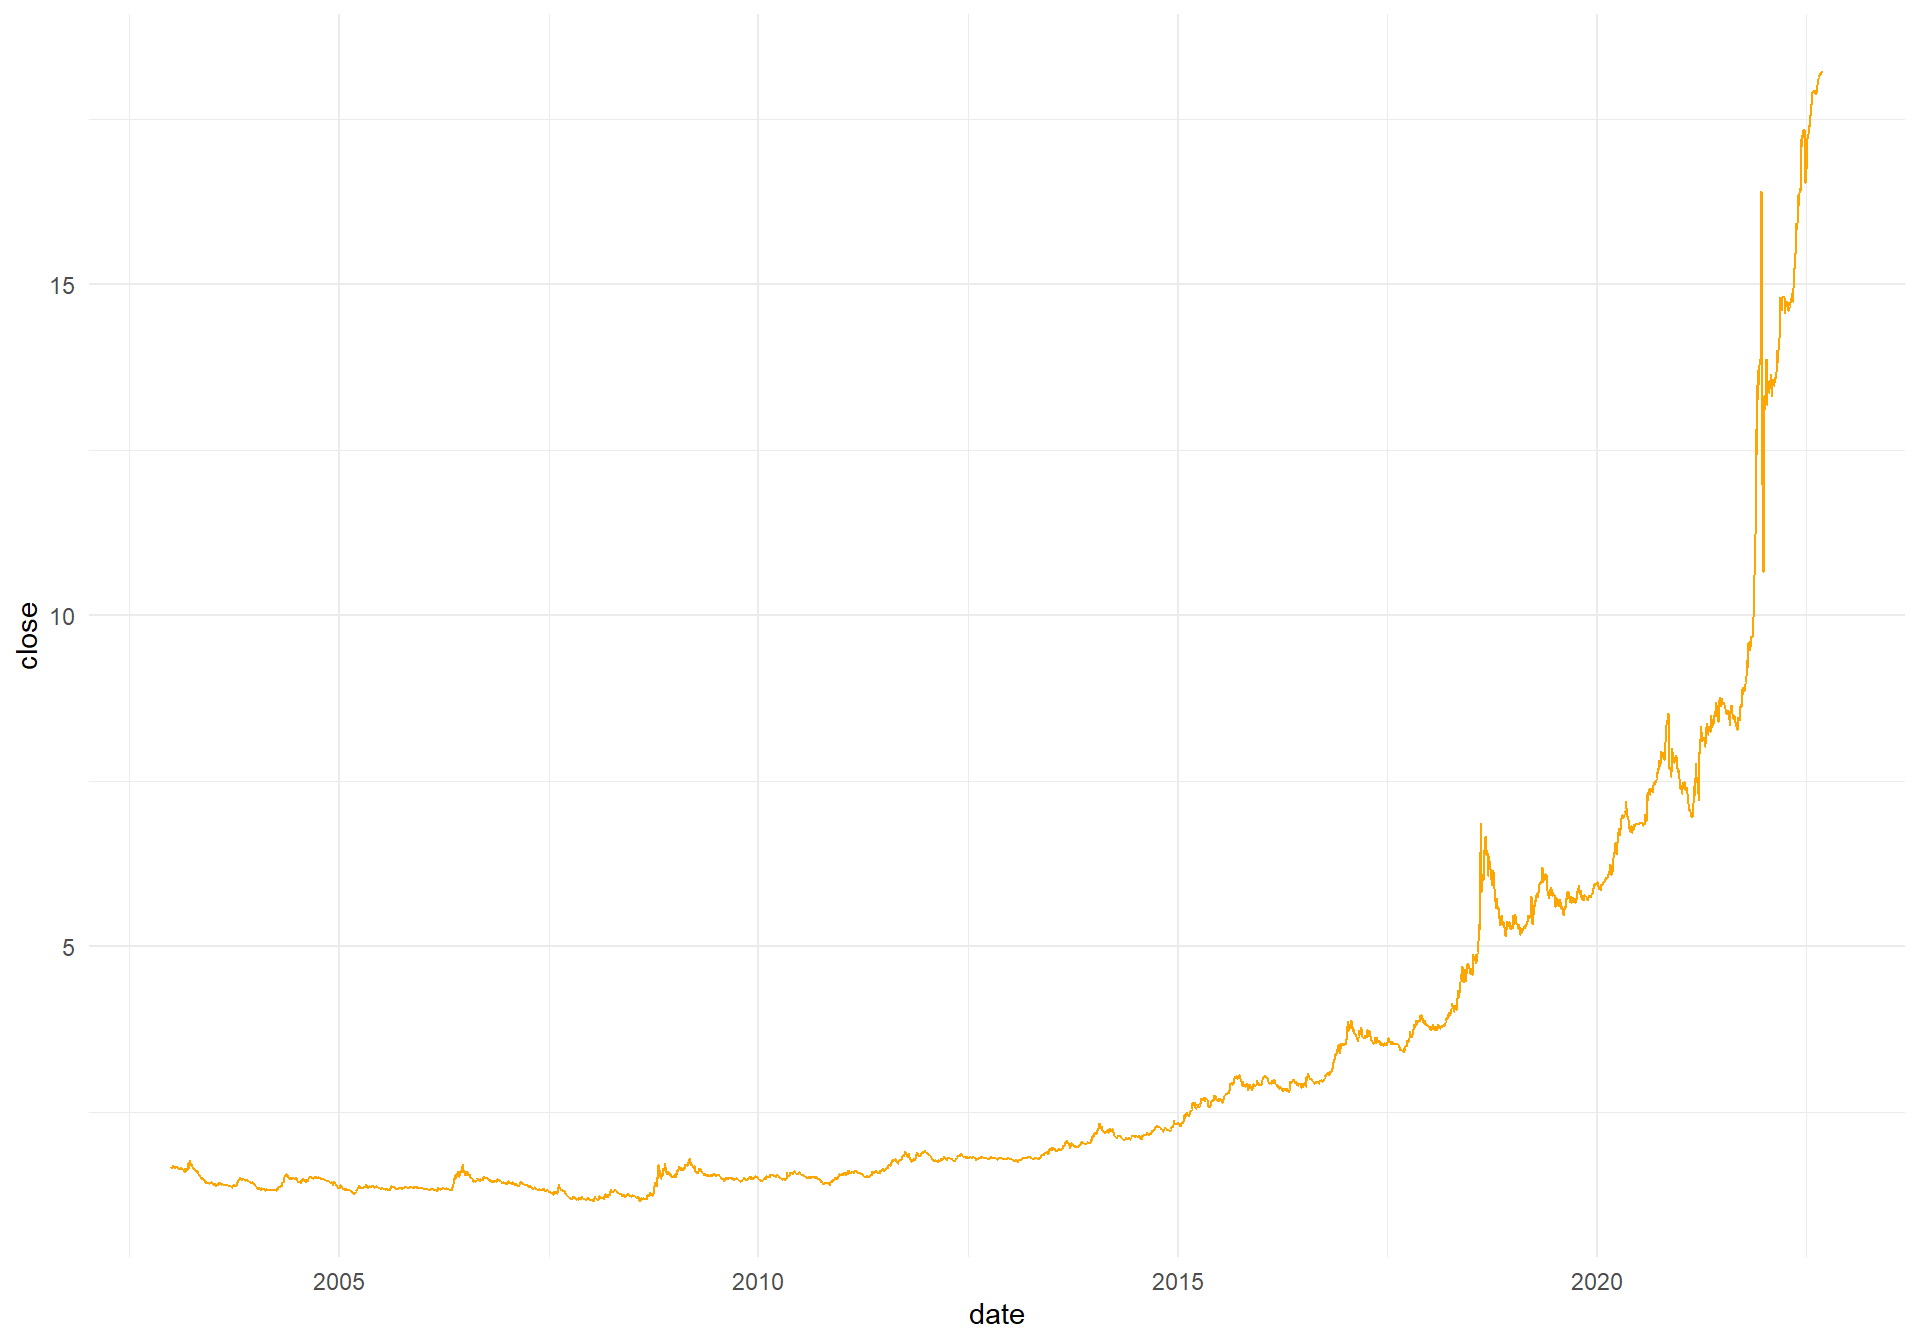
Making the line orange could be a good starting point.
ggplot(df, aes(x = date, y = close)) +
  geom_line(color = "#ffa500") +
  theme_minimal()
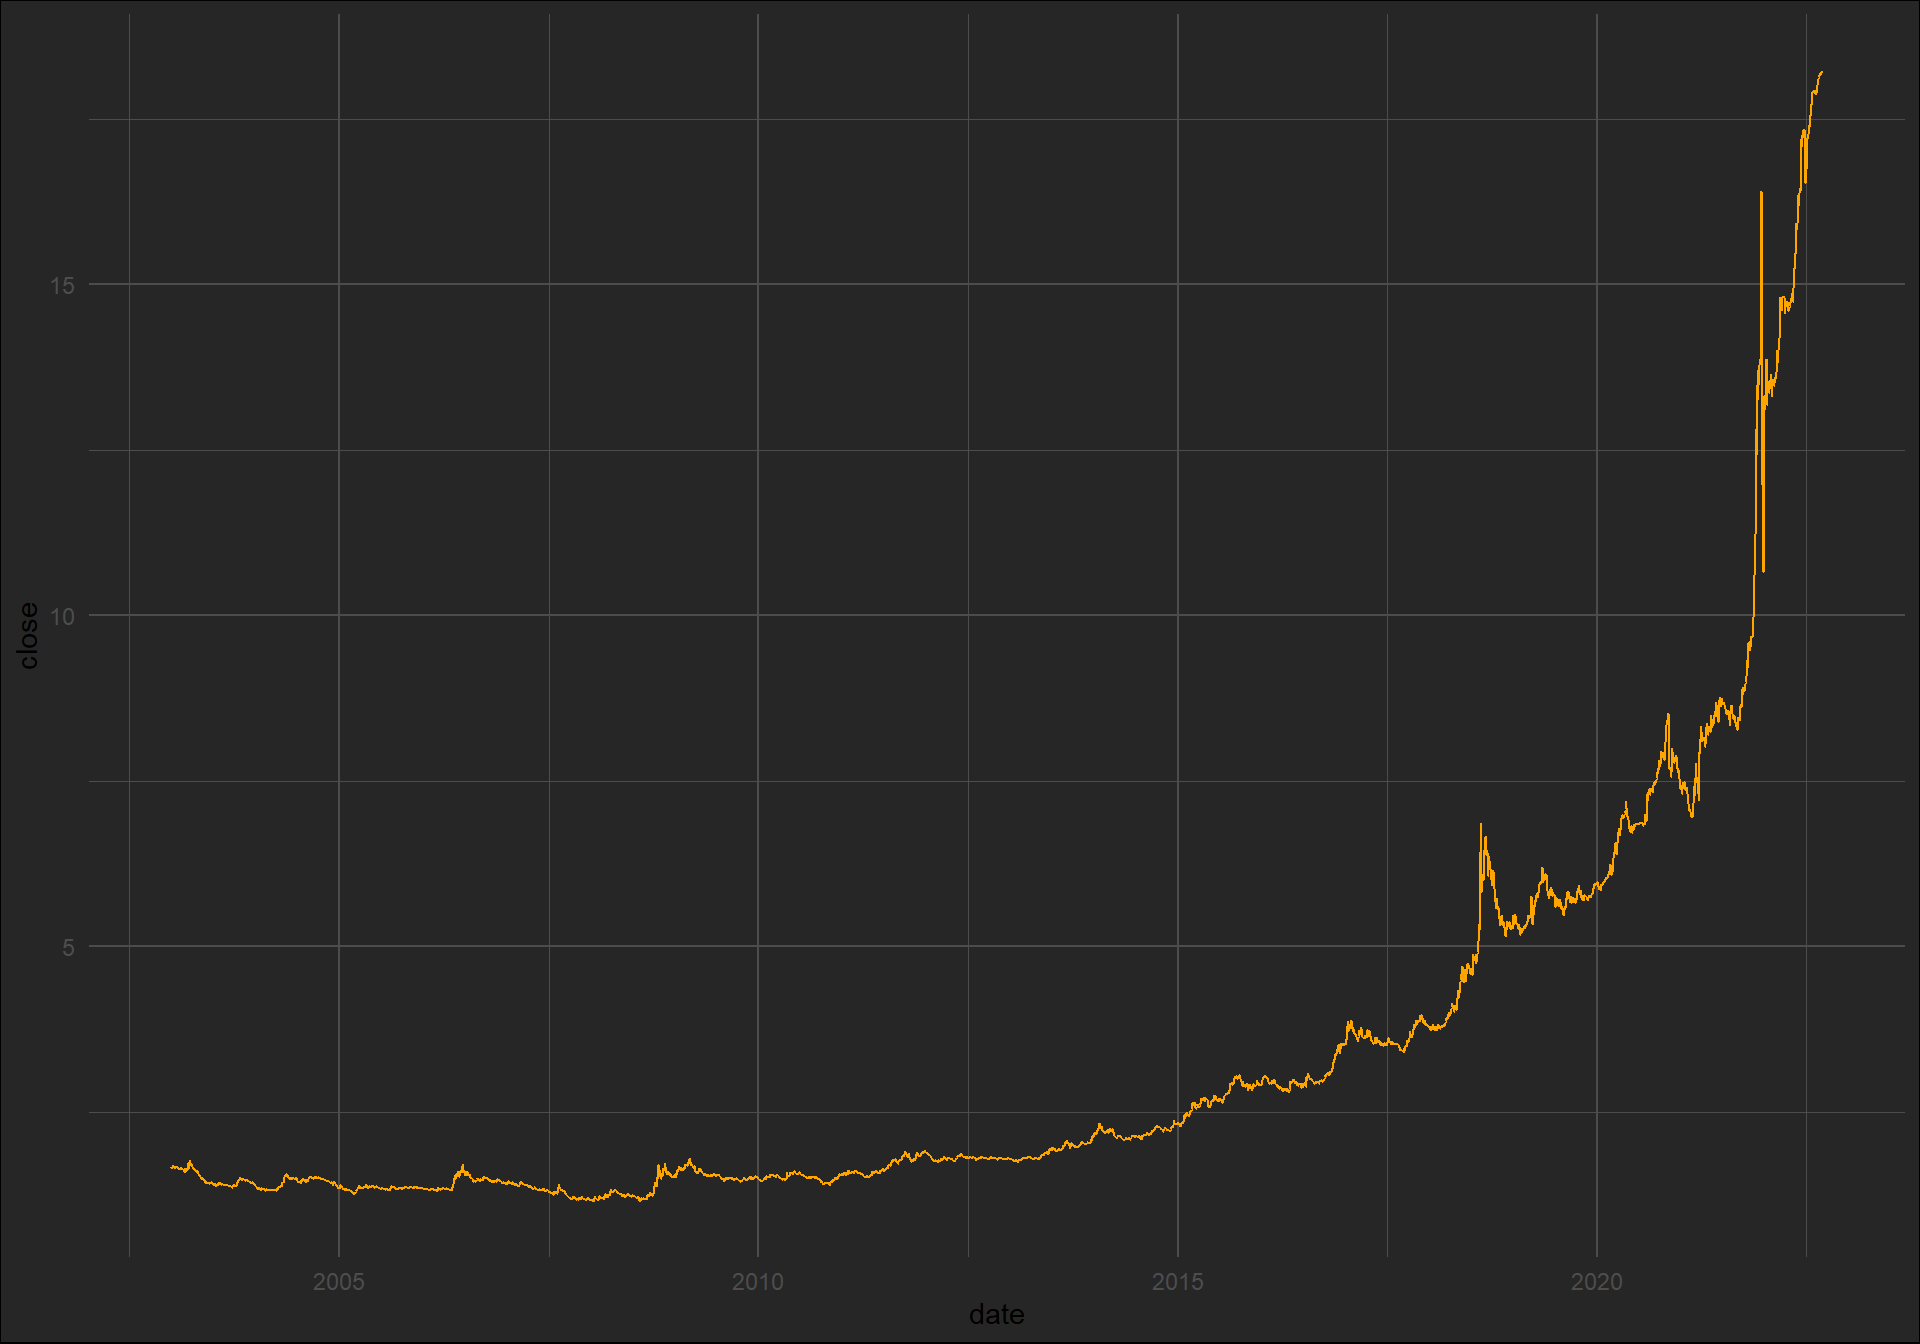
Darken the background.
ggplot(df, aes(x = date, y = close)) +
  geom_line(color = "#ffa500") +
  theme_minimal() +
  theme(
    plot.background = element_rect(fill = "#262626")
  )

Change the colors of the grid lines.
ggplot(df, aes(x = date, y = close)) +
  geom_line(color = "#ffa500") +
  theme_minimal() +
  theme(
    plot.background = element_rect(fill = "#262626"),
    panel.grid = element_line(color = "#4c4c4c")
  )
Make the axis texts white, remove the axis titles and place y-axis on the right.
ggplot(df, aes(x = date, y = close)) +
  geom_line(color = "#ffa500") +
  theme_minimal() +
  theme(
    plot.background = element_rect(fill = "#262626"),
    panel.grid = element_line(color = "#4c4c4c"),
    axis.title = element_blank(),
    axis.text = element_text(color = "#ffffff")
  ) +
  scale_y_continuous(position = "right")
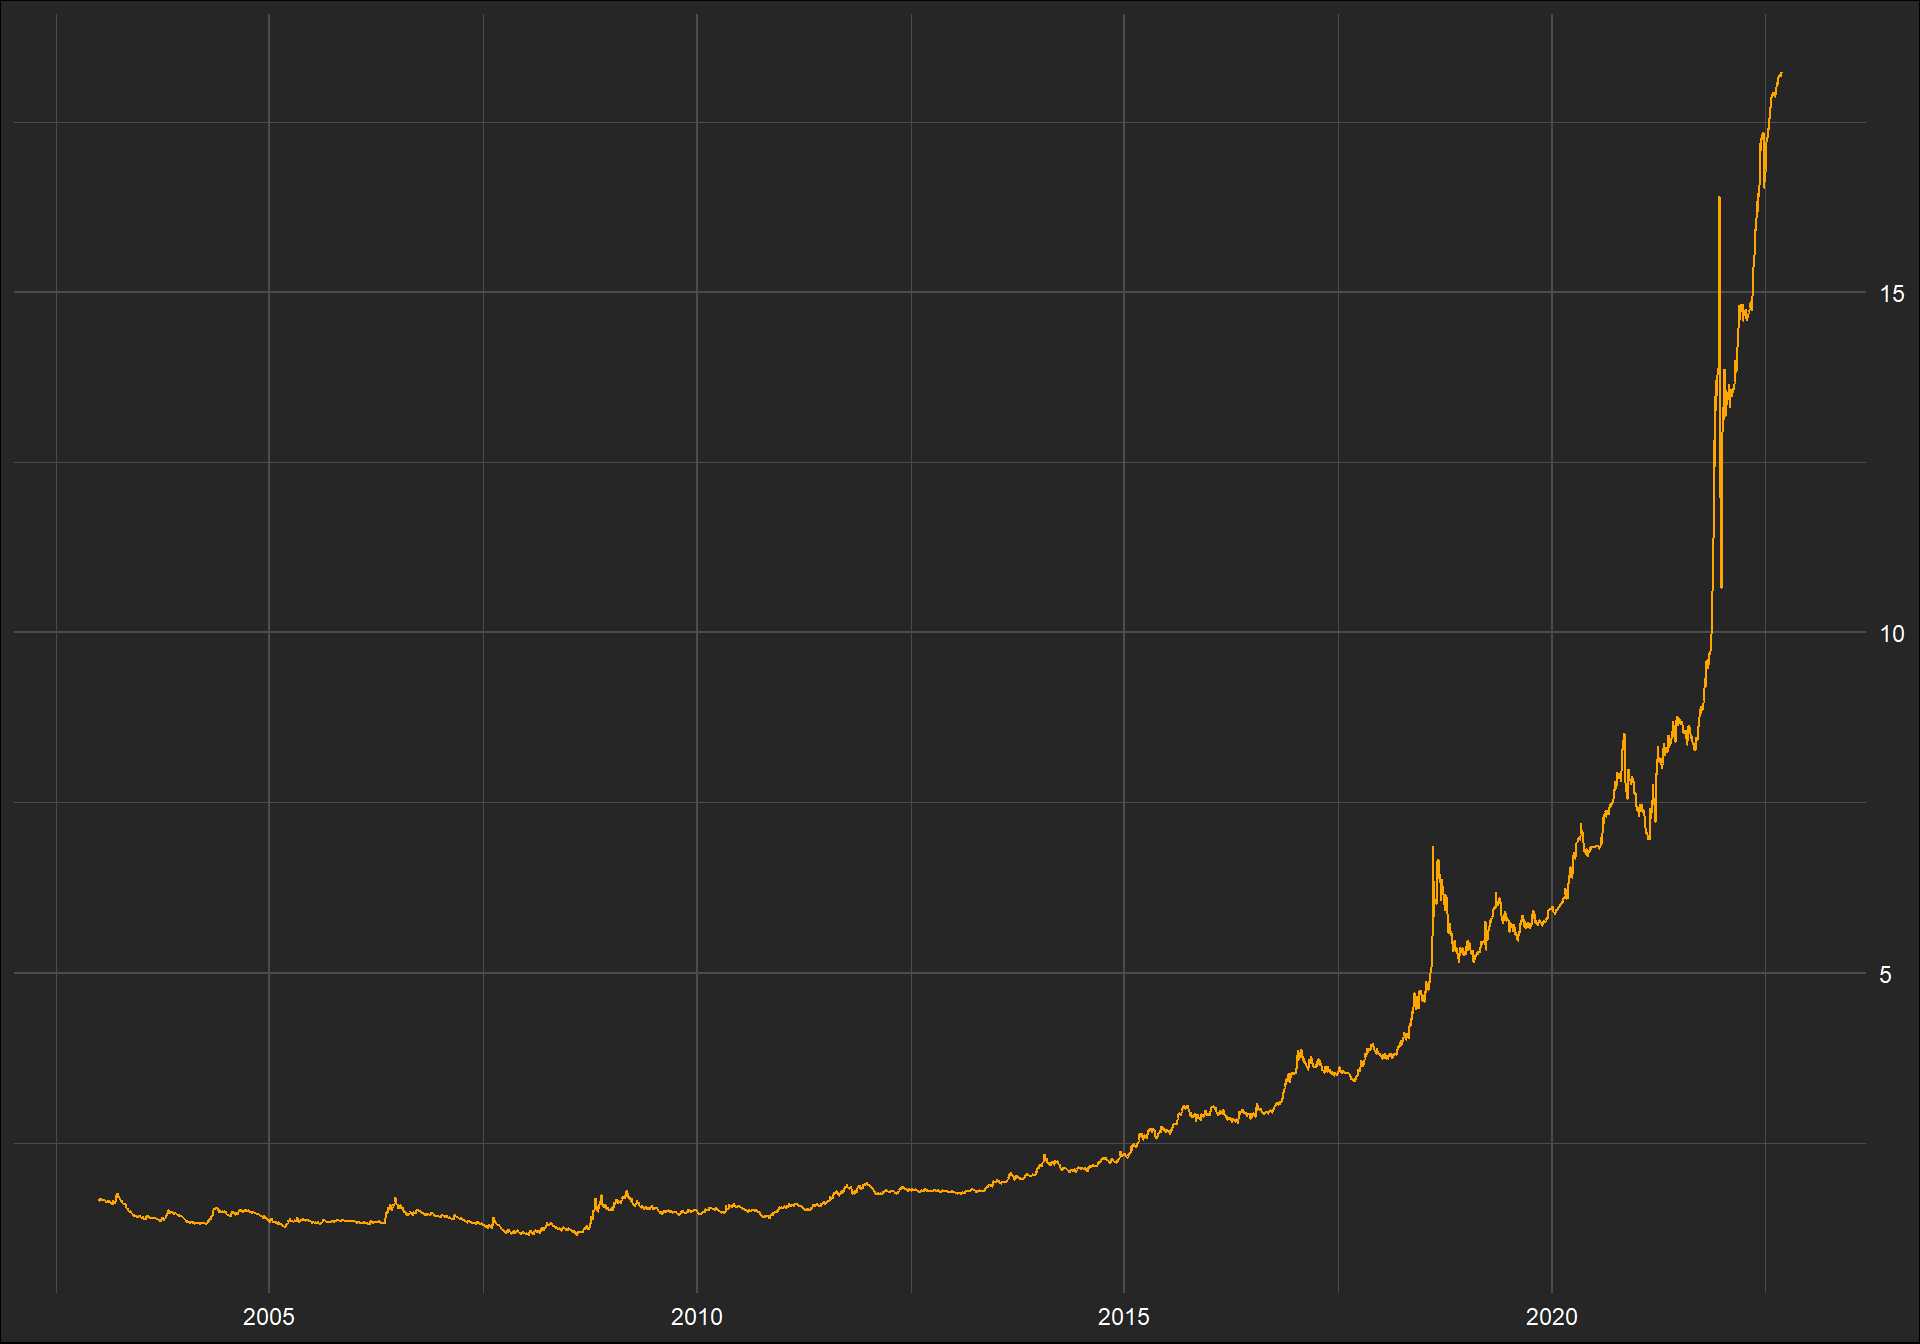
Finally, we may have made the most significant contribution here. The area under the line will be filled and its transparency will be adjusted in this step.
ggplot(df, aes(x = date, y = close)) +
  geom_line(color = "#ffa500", size = 1, alpha = 0.9) +
  geom_area(alpha = 0.1, fill = "#ffa500") +
  theme(
    plot.background = element_rect(fill = "#262626"),
    panel.background = element_blank(),
    panel.grid = element_line(color = "#4c4c4c"),
    axis.title = element_blank(),
    axis.text = element_text(color = "#ffffff", size = 20)
  ) +
  scale_y_continuous(position = "right")
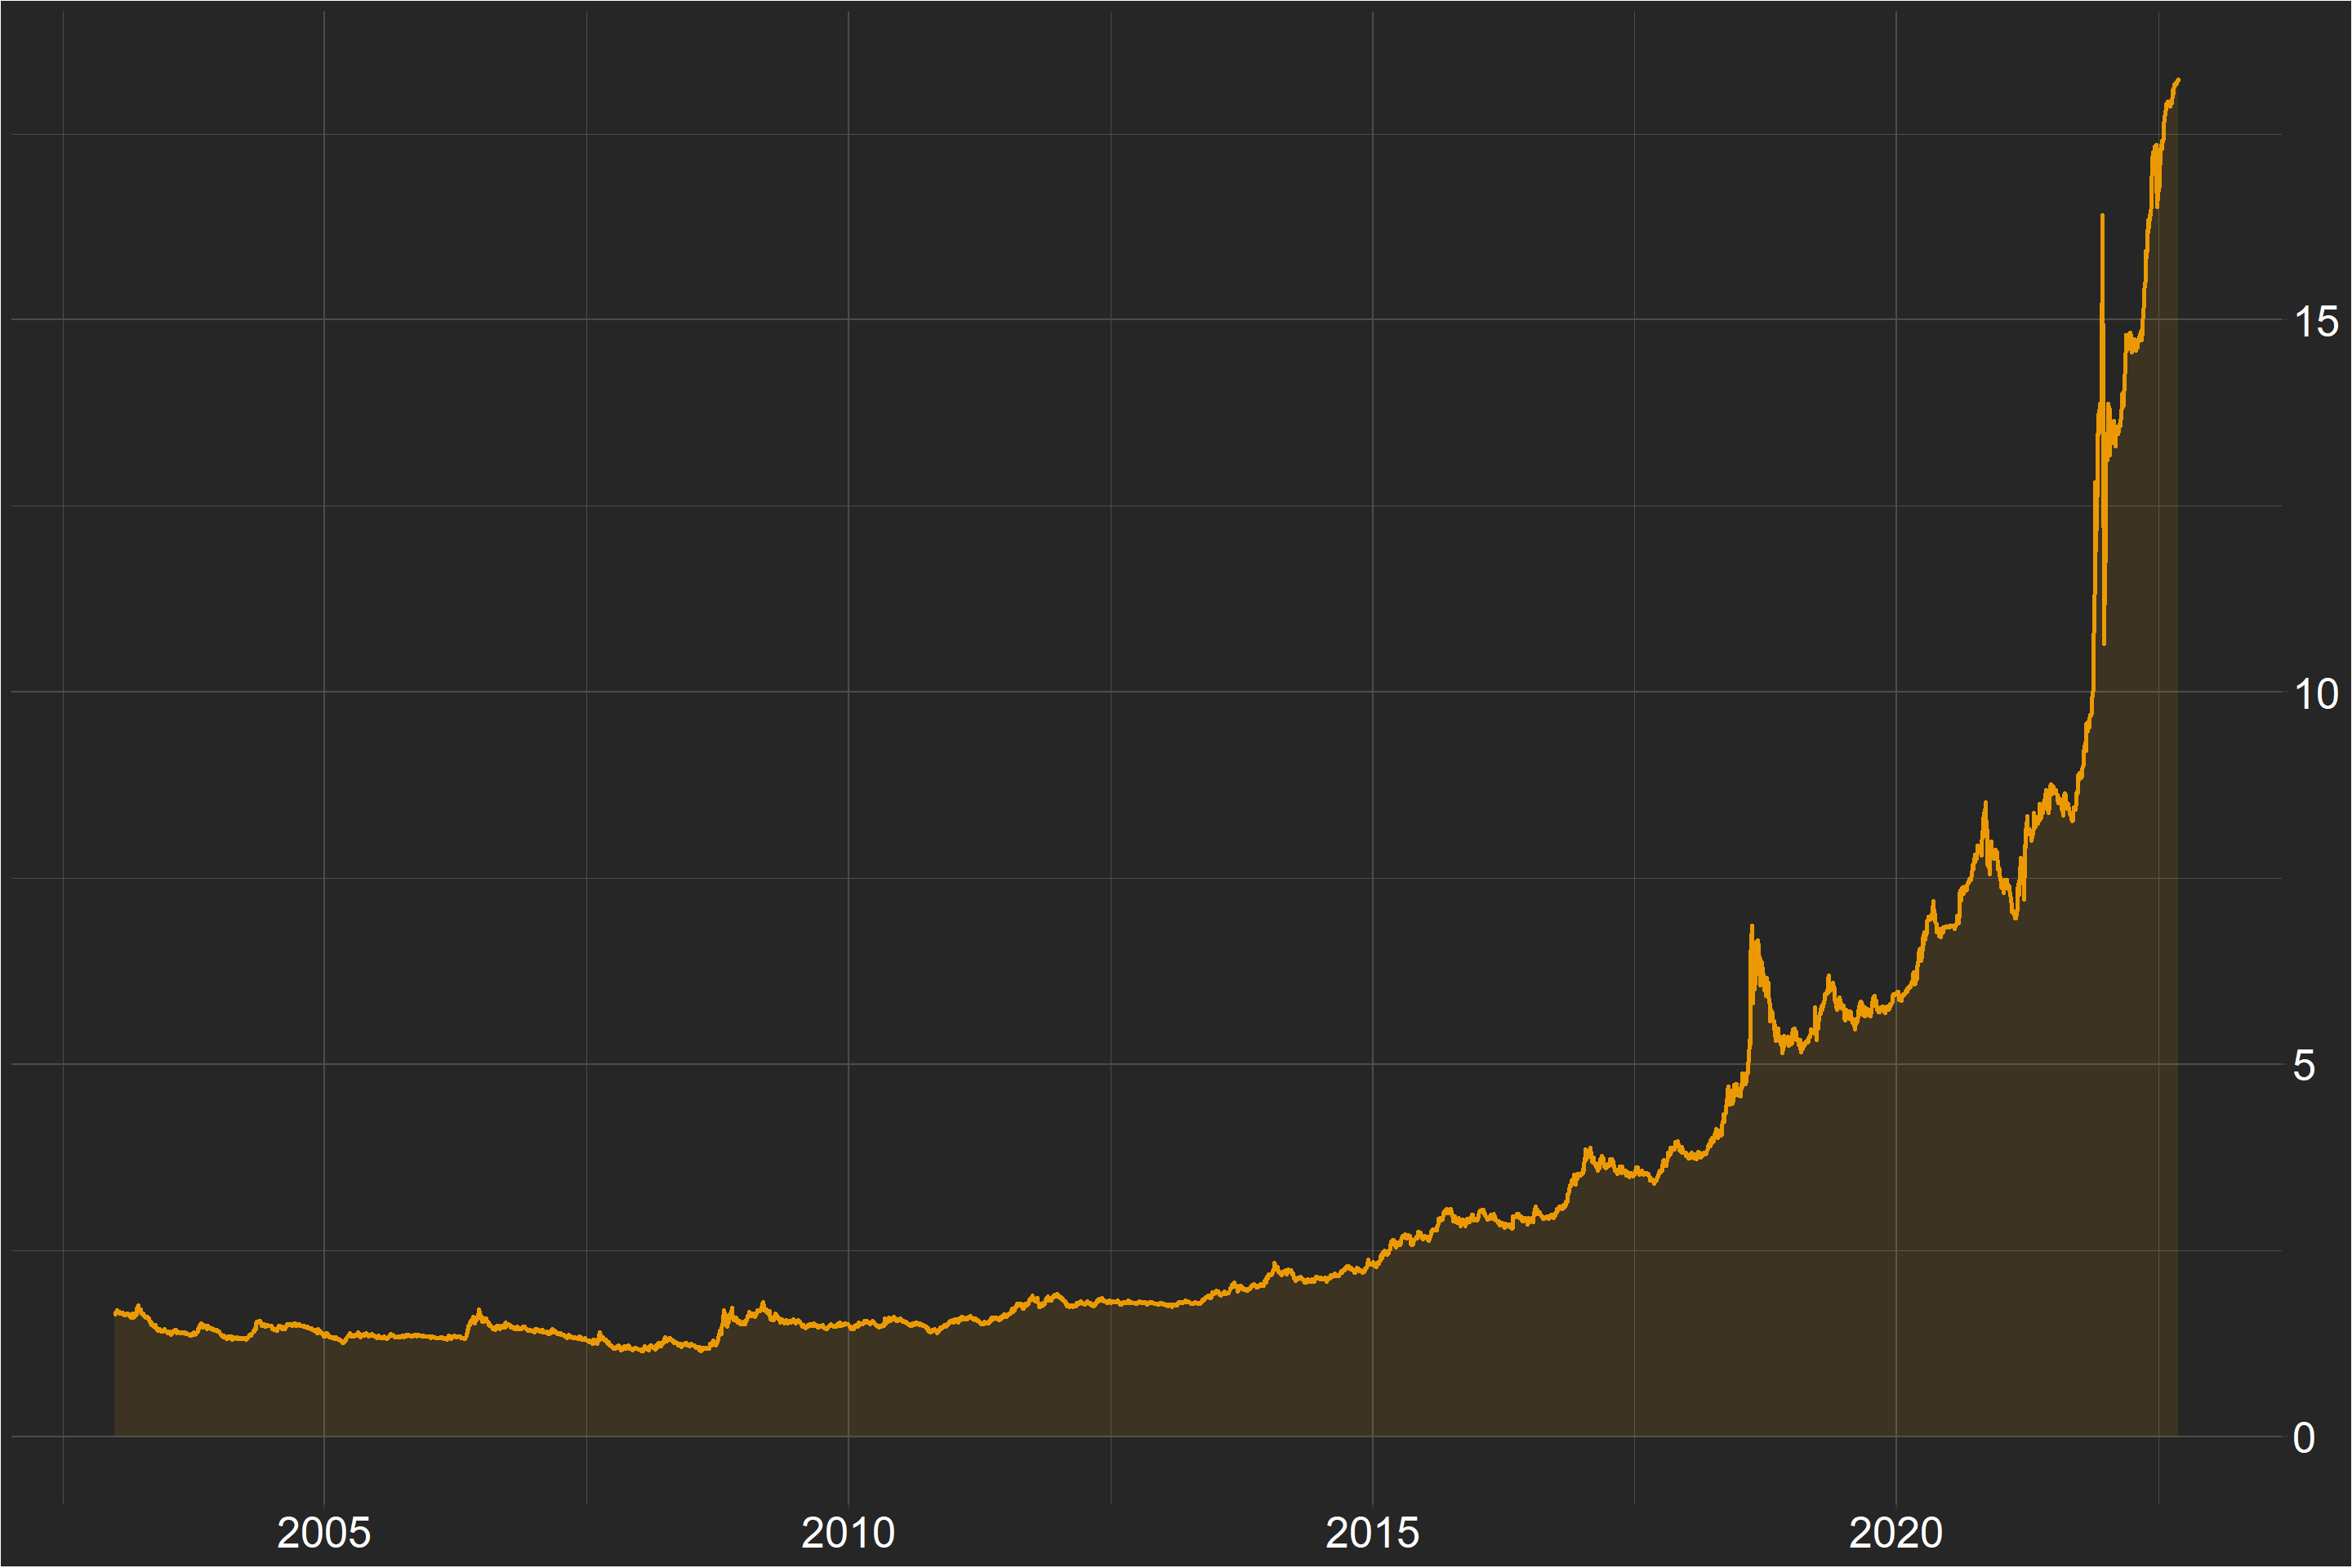
Someone looking at the chart will most likely identify it as a Reuters type chart! :-)
Don’t forget about your contributions!