In this post, I’ll show you how to split groups using facet_wrap() in ggplot2. I’d like to point out that I prefer the second method over the first because it is more informative.
You can access the data we’ll be using by downloading the post24.xlsx file from here or by following the steps below.
Interest Rates
Weighted Average Interest Rates For Banks Loans (Flow Data, %)). Select the following items and click the Add button:
Personal (TRY)(Flow Data, %)
Vehicle (TRY)(Flow Data, %)
Housing (TRY)(Flow Data, %)
Commercial (TRY)(Flow Data, %)
Date From: 01-01-2019, Date To: 26-08-2022. Click the Create Report icon under Report Settings.
You’ll see the excel icon.
library(tidyverse)

df <- readxl::read_excel("data.xlsx") %>%
  pivot_longer(!date, names_to = "vars", values_to = "vals") %>%
  mutate(date = lubridate::dmy(date))
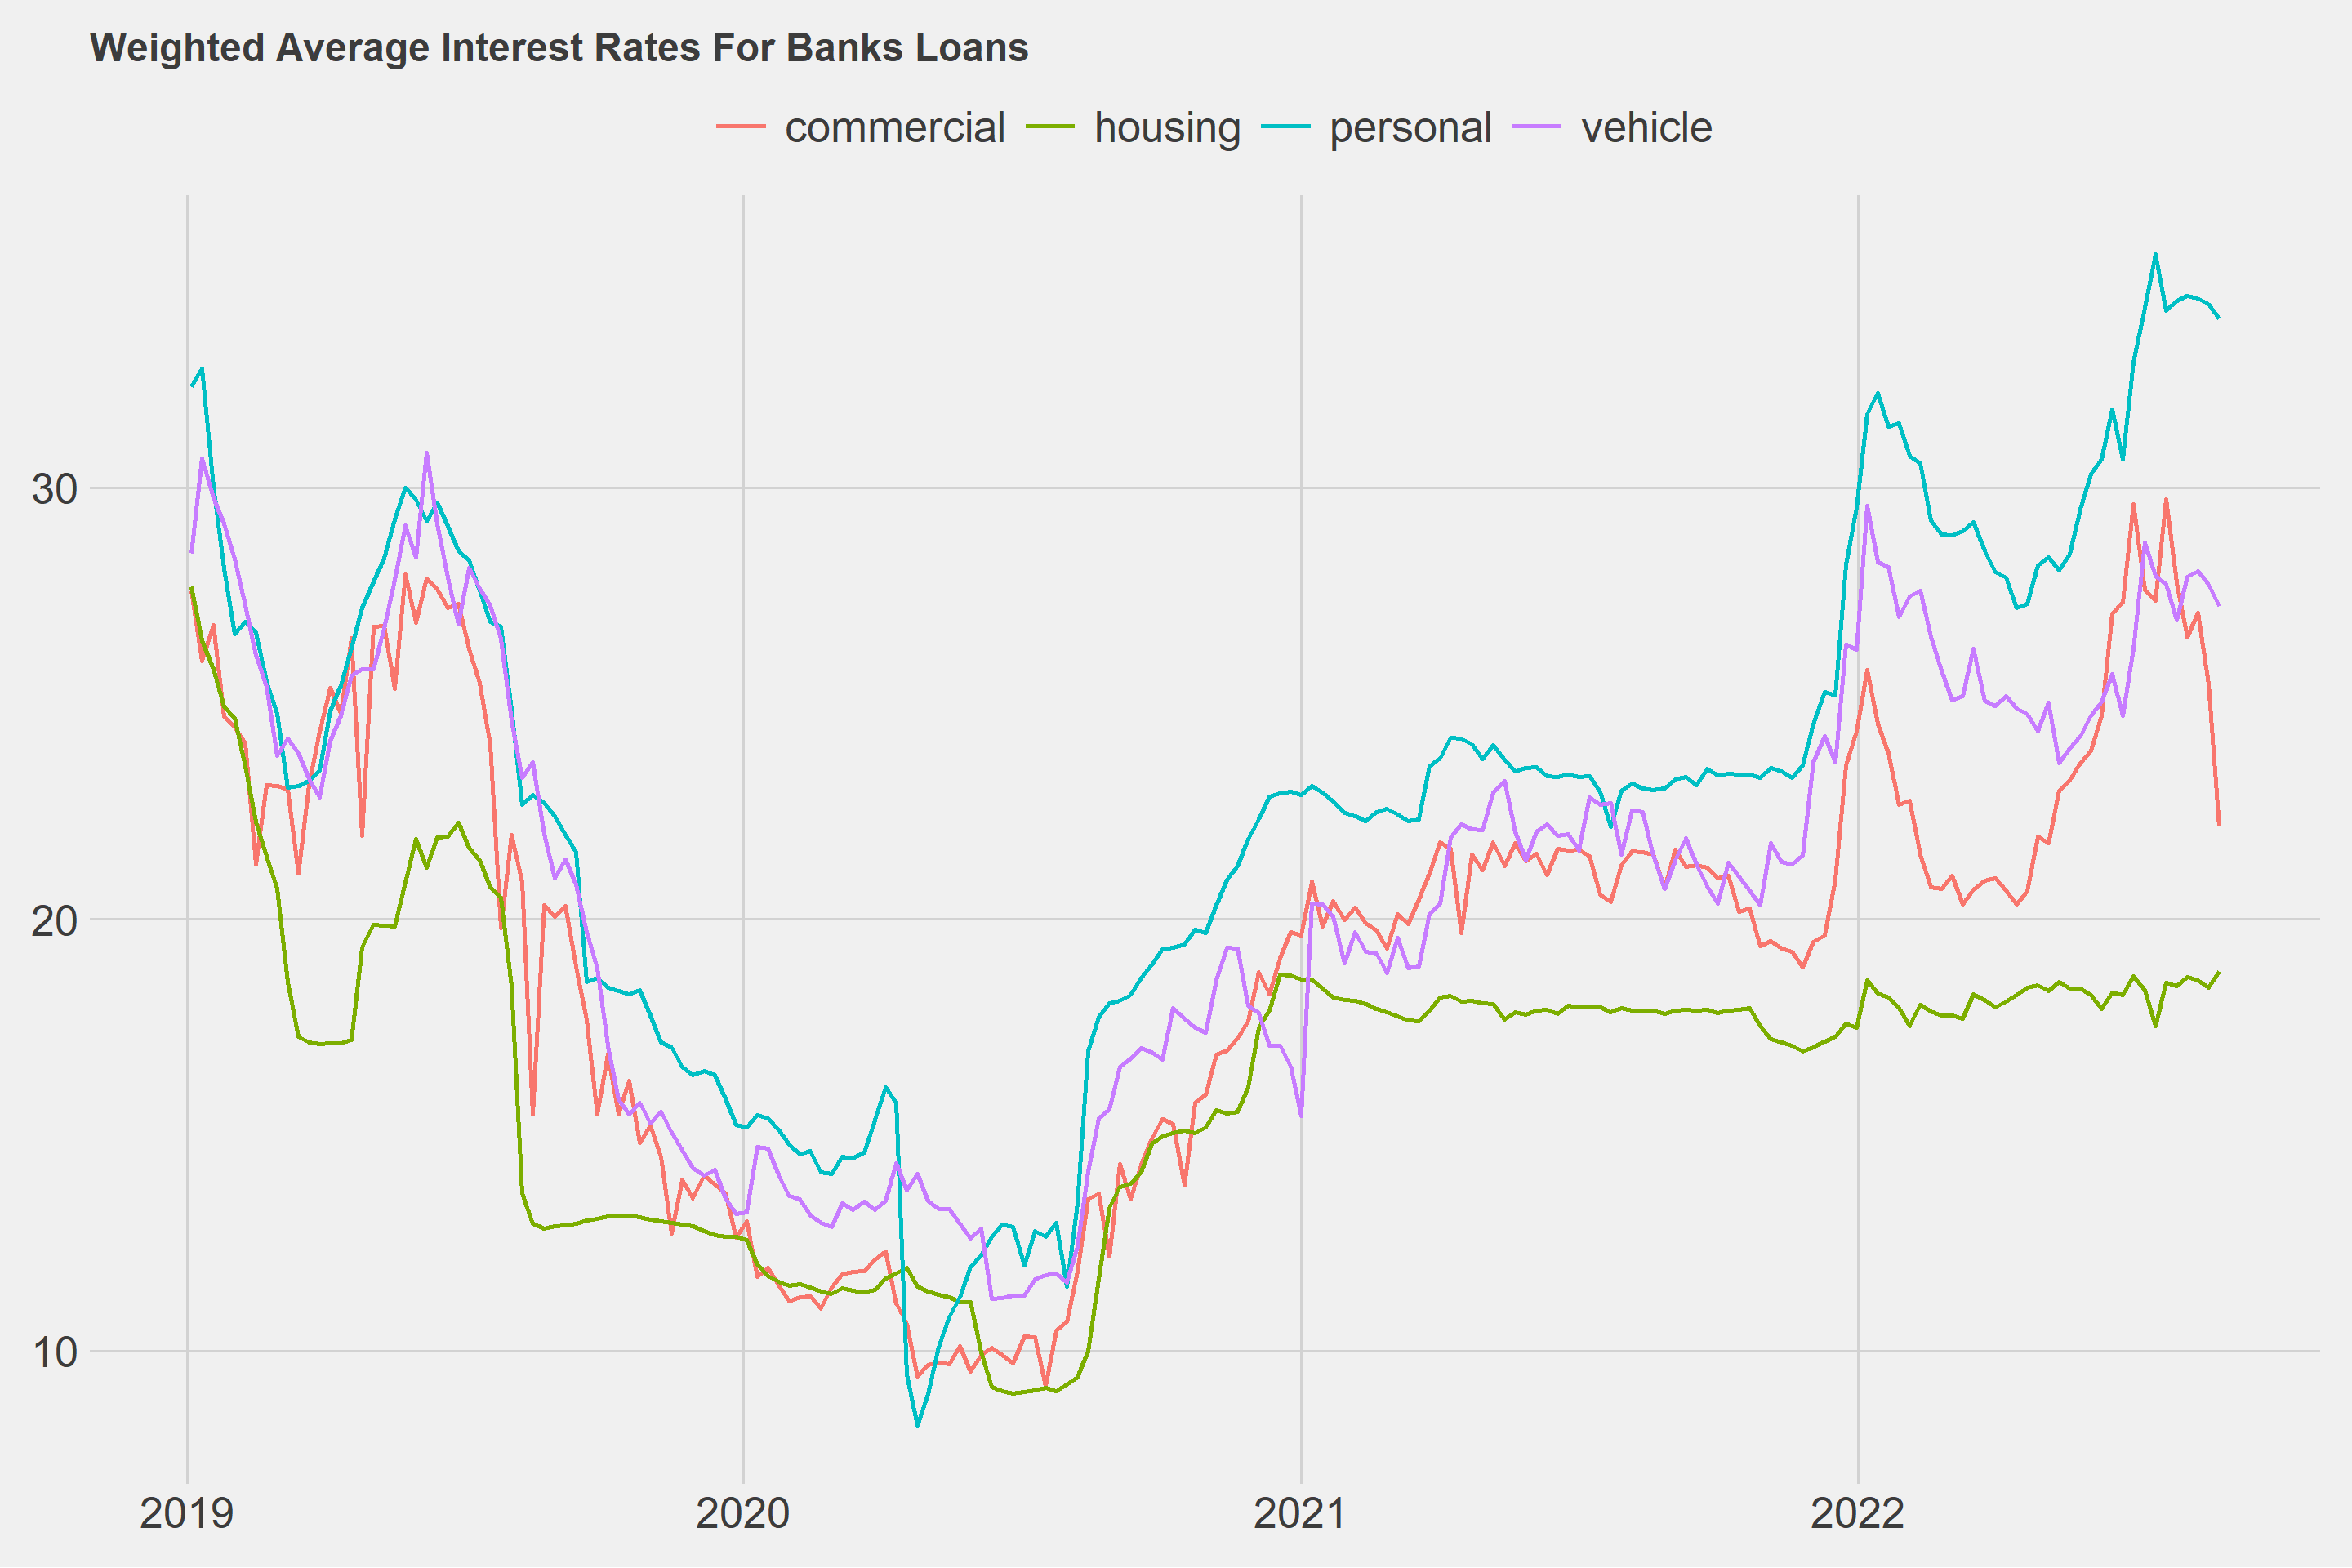
0. Before splitting groups with facet_wrap()
ggplot(df, aes(x = date, y = vals, group = vars, color = vars)) +
  geom_line(size = 1) +
  ggthemes::theme_fivethirtyeight() +
  theme(legend.title = element_blank(),
        legend.position = "top",
        legend.key.size = unit(1, 'cm'),
        legend.text = element_text(size = 20),
        axis.text = element_text(size = 20)) +
  labs(
    title = "Weighted Average Interest Rates For Banks Loans"
  )
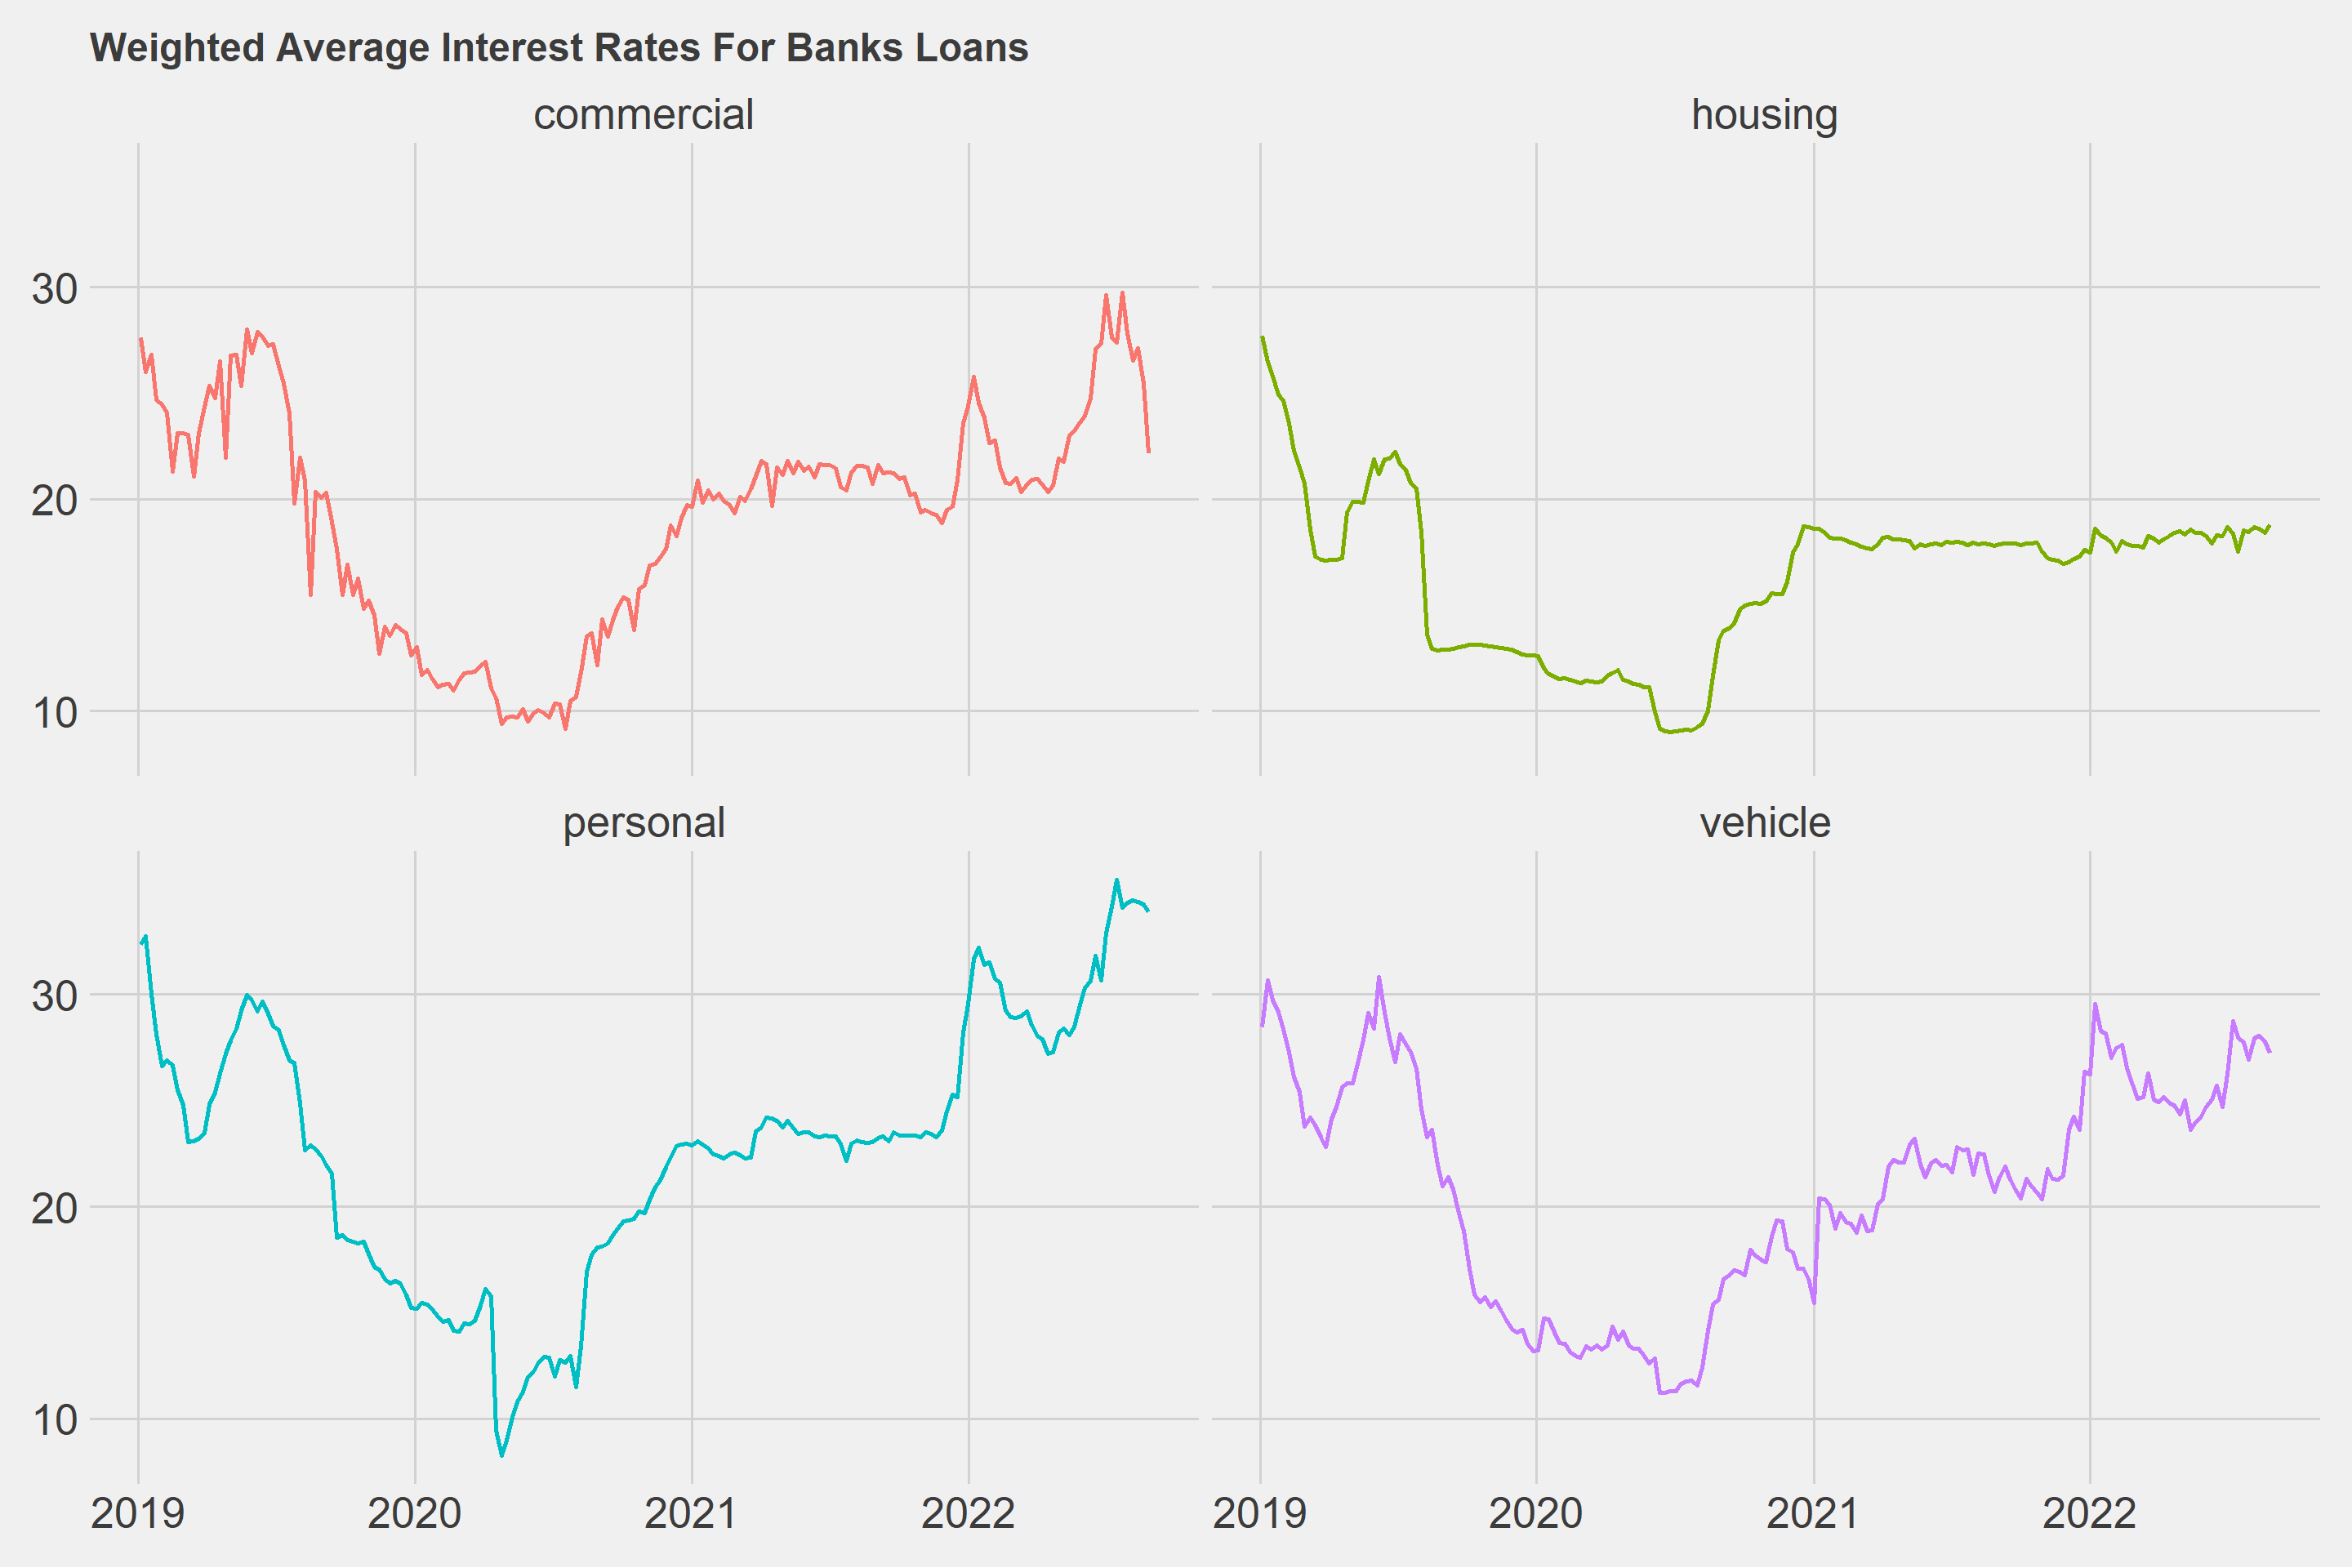
1. Splitting groups with facet_wrap()
ggplot(df, aes(x = date, y = vals, group = vars, color = vars)) +
  geom_line(size = 1) +
  ggthemes::theme_fivethirtyeight() +
  theme(strip.text = element_text(size = 20),
        legend.position = "none",
        axis.text = element_text(size = 20)) +
  facet_wrap(~vars) +
  labs(
    title = "Weighted Average Interest Rates For Banks Loans"
  )
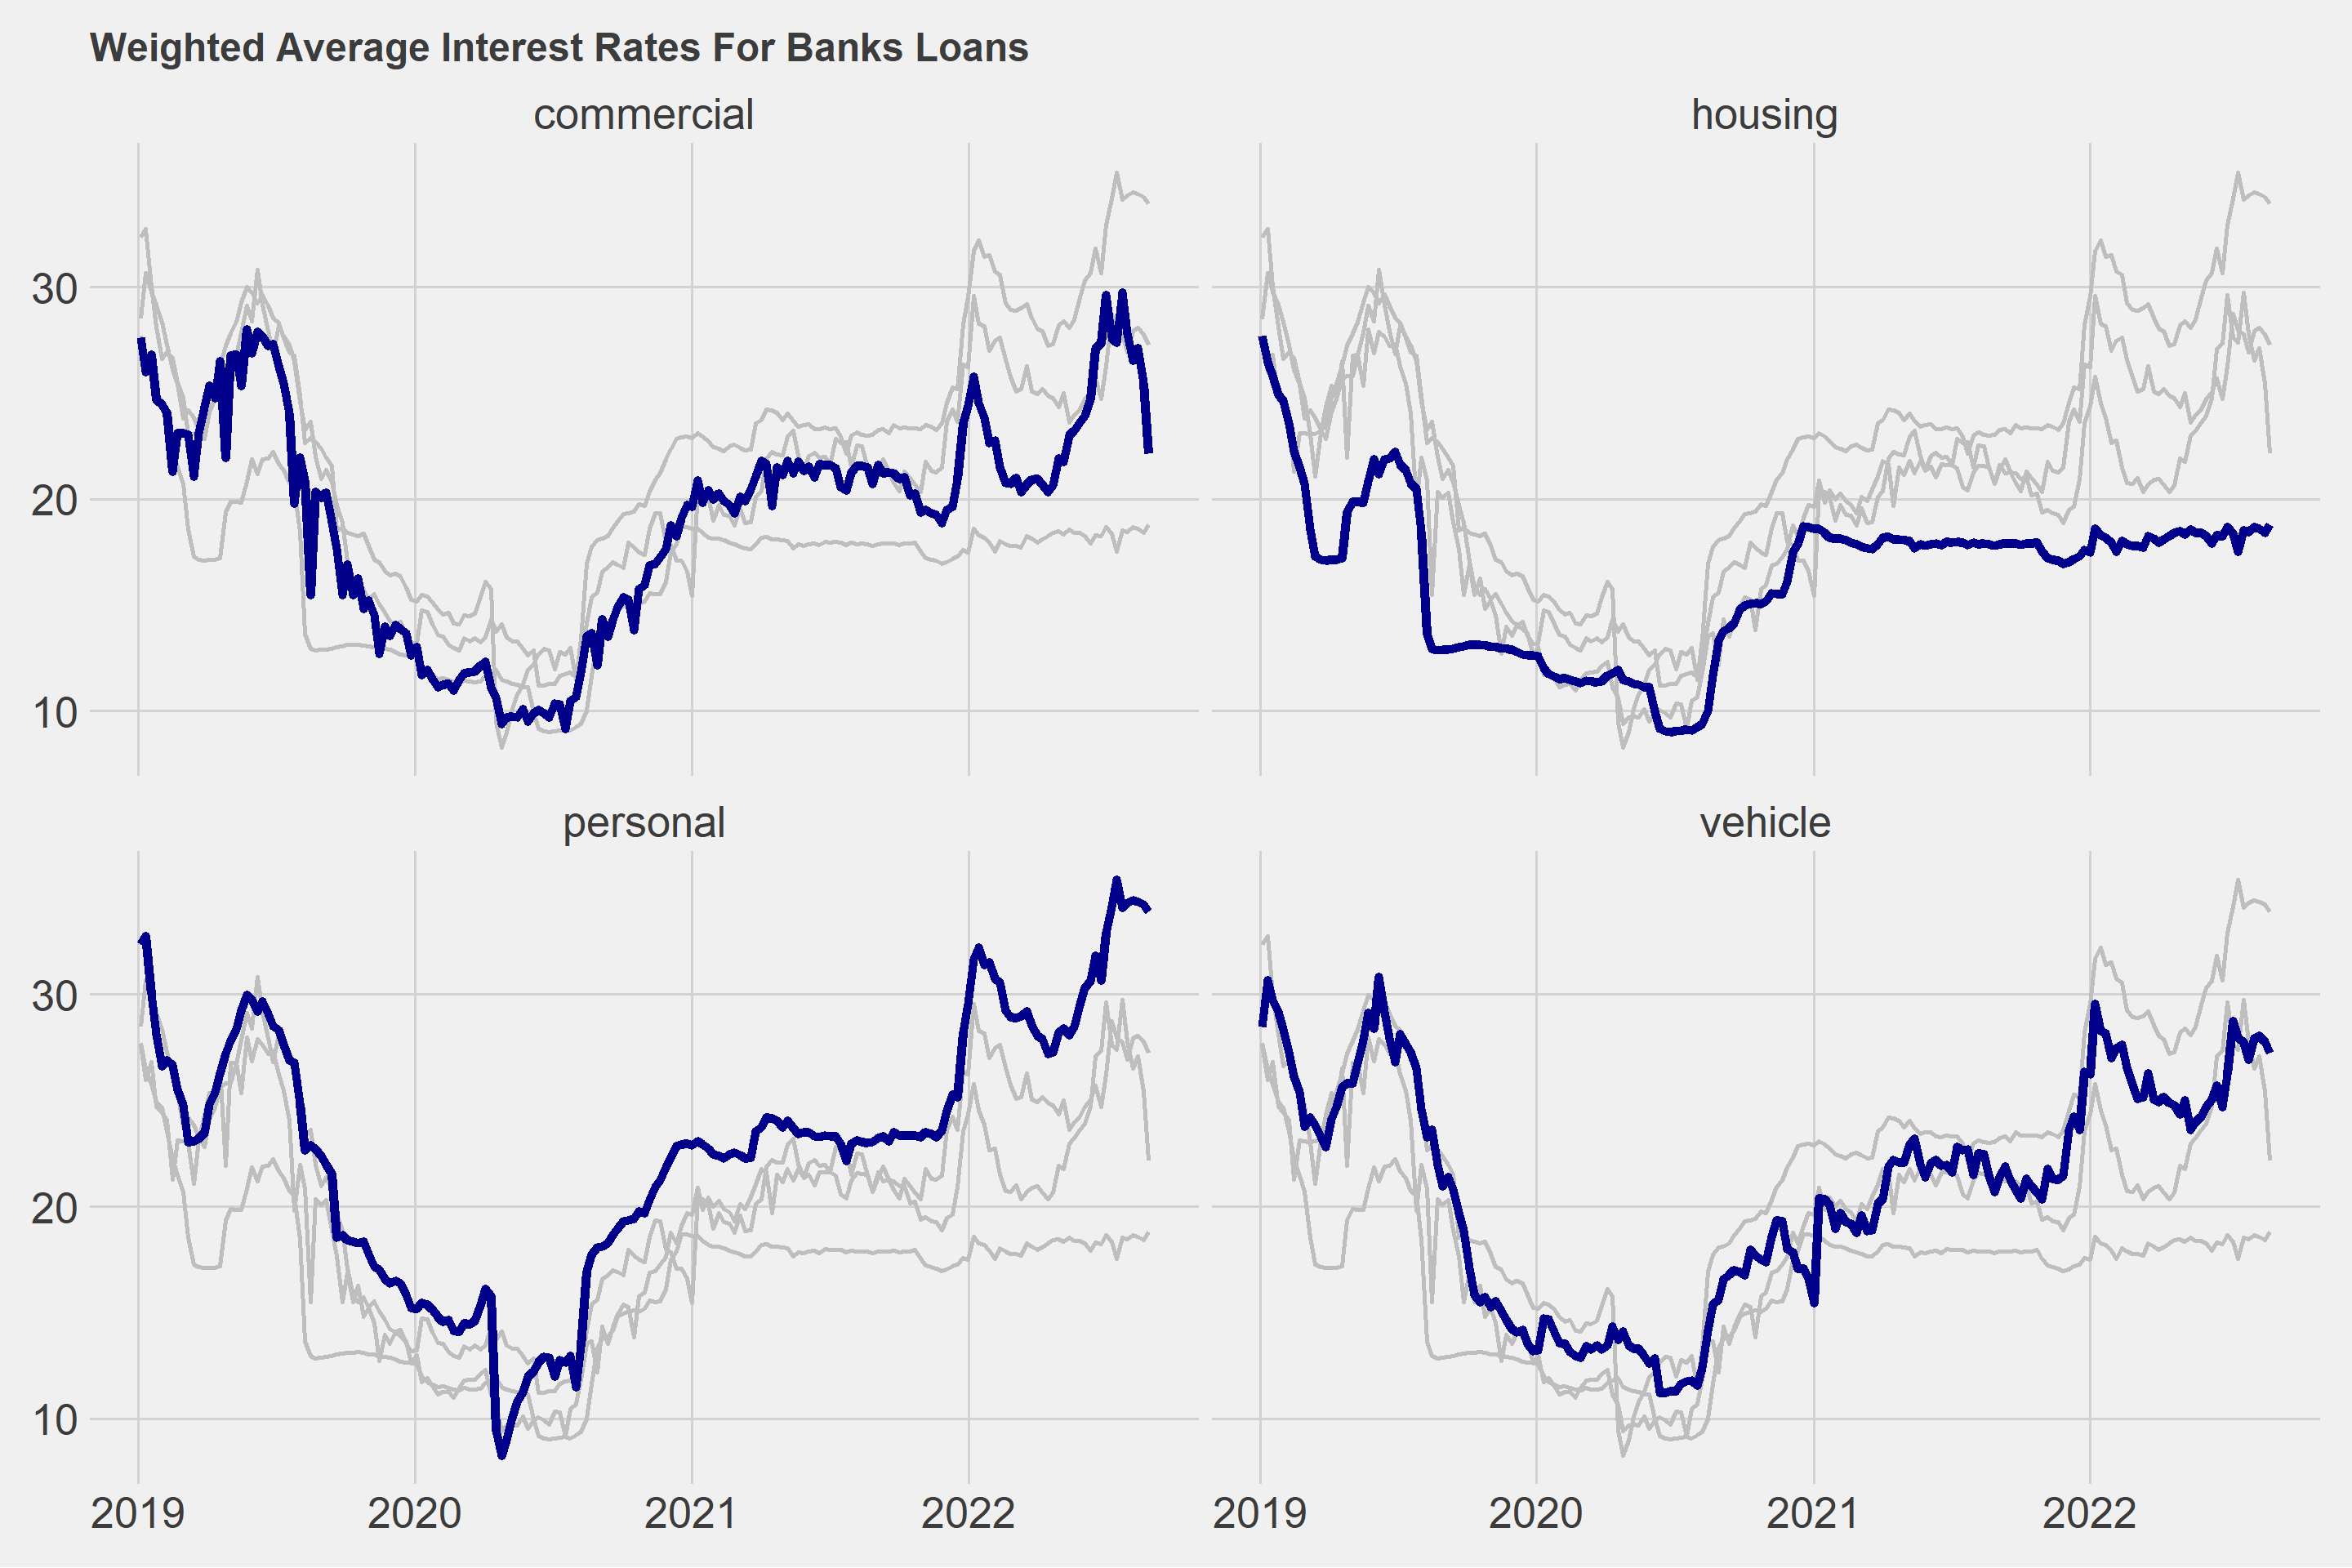
2. Splitting groups with facet_wrap() using other variables
When making comparisons between variables, I would prefer the second option most of the time.
ggplot(df, aes(x = date, y = vals)) +
  geom_line(data = df %>% rename(vars2 = vars), aes(group = vars2), color = "gray", size = 1) +
  geom_line(color = "dark blue", size = 2) +
  ggthemes::theme_fivethirtyeight() +
  theme(strip.text = element_text(size = 20),
        axis.text = element_text(size = 20)) +
  facet_wrap(~vars, ncol = 2) +
  labs(
    title = "Weighted Average Interest Rates For Banks Loans"
  )